
Device Visualization & Graph Plotting
![]()
GTS Vision is a multi-dimensional device visualization and graph plotting tool. As an integral part of GTS Framework, Vision is always at hand for instantly viewing simulation results. Post-processing is available as well as exporting images and videos for presentation.
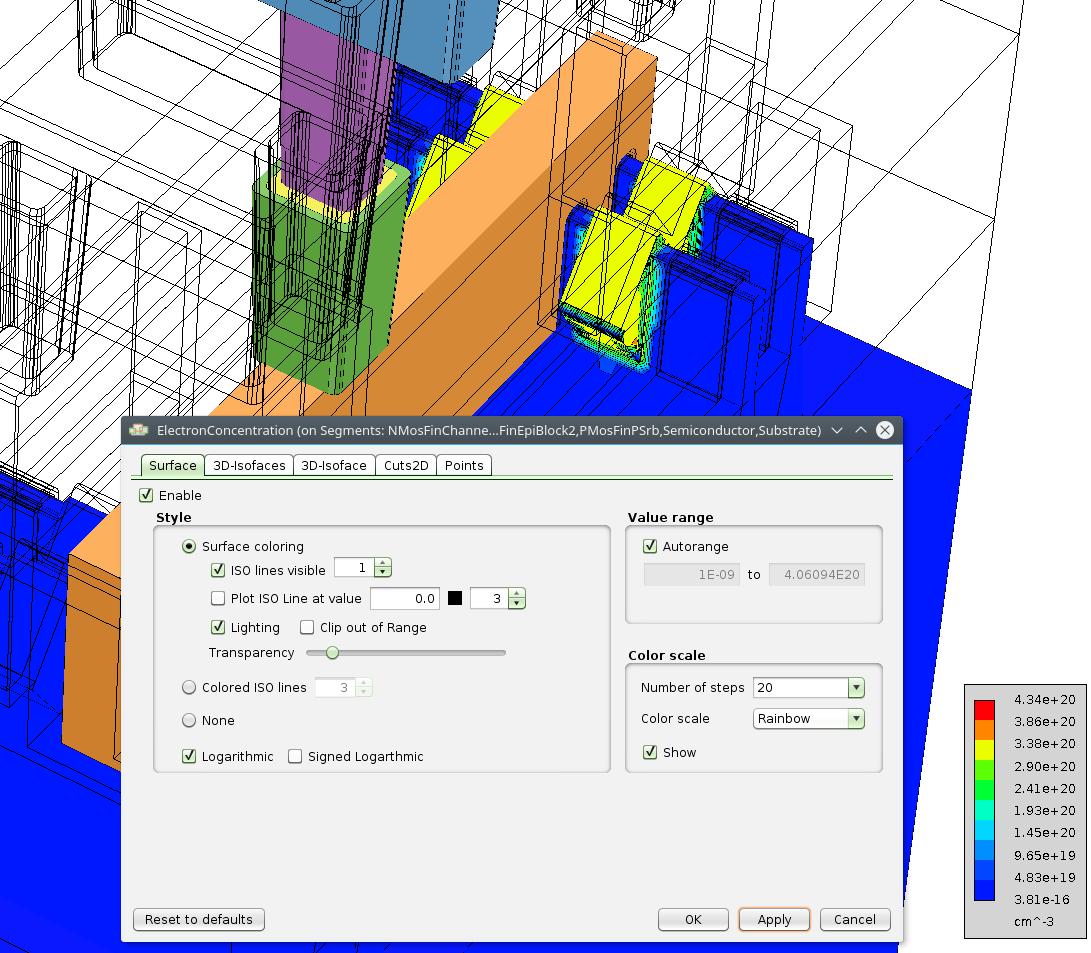
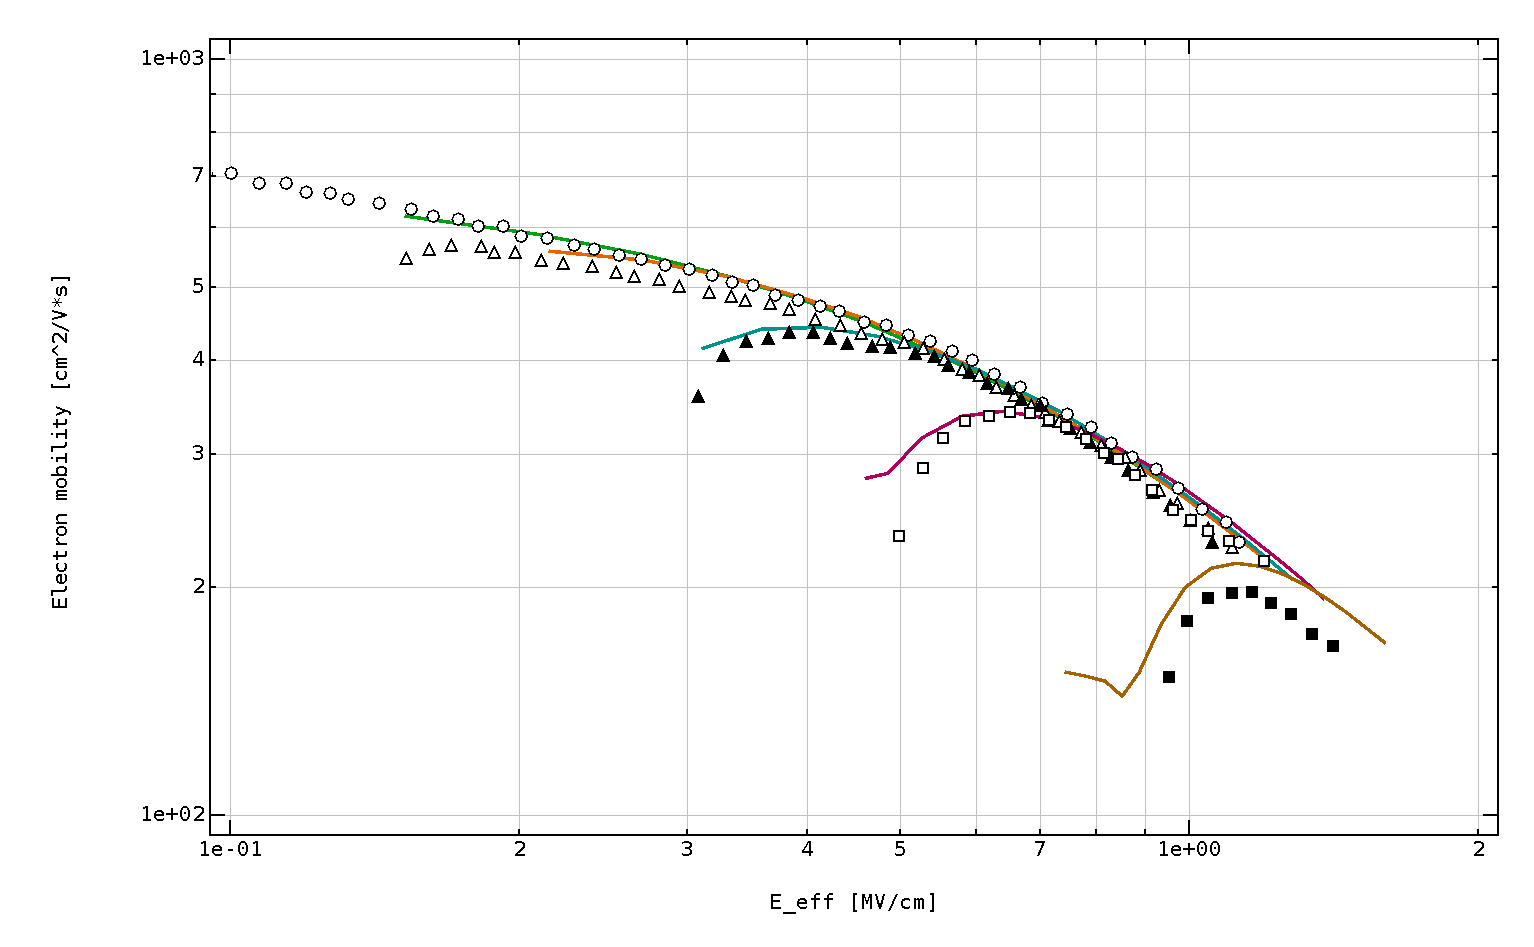
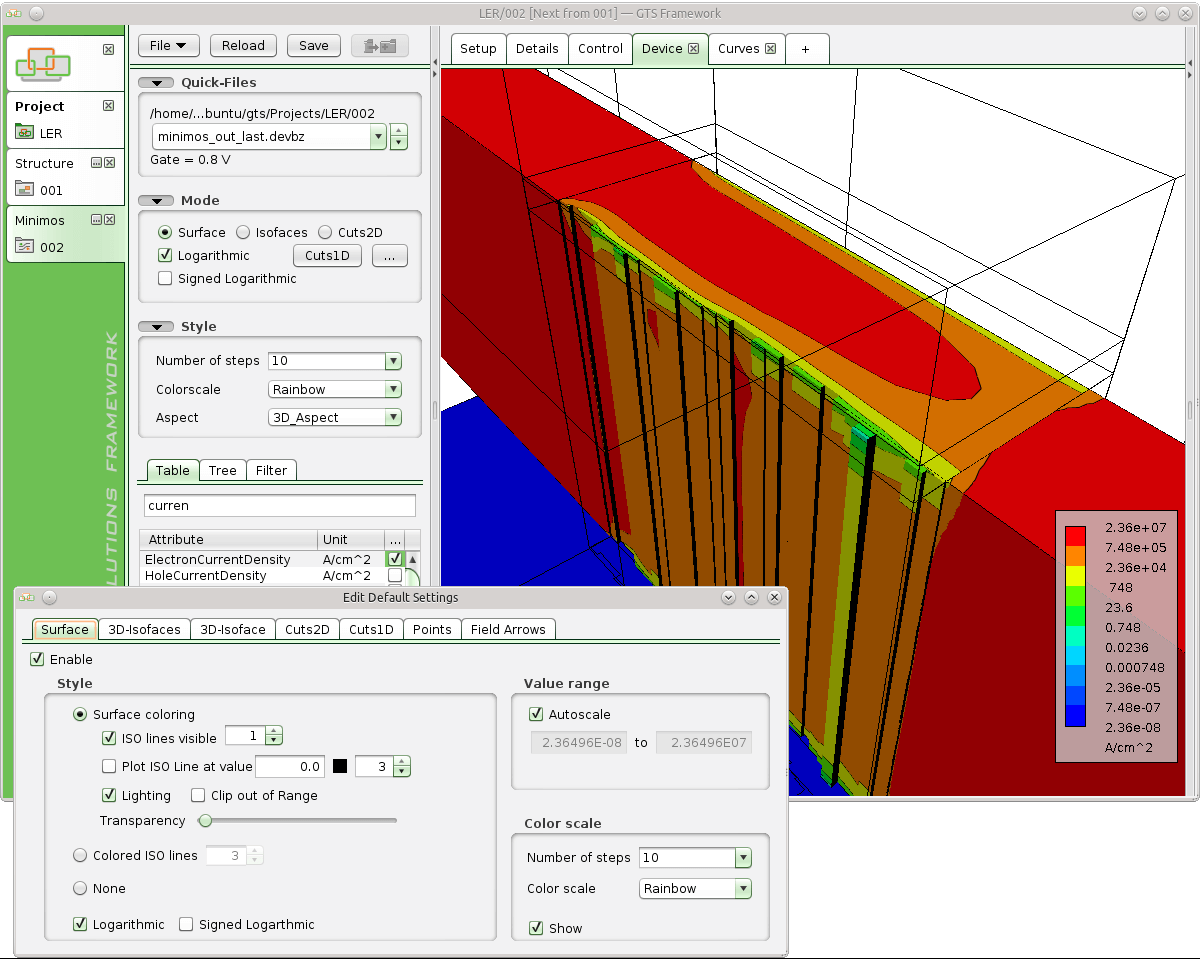 Easily visualize 1D/2D/3D device structures, display geometry and doping profiles. Simulation data, of both vector or scalar type, can be displayed in a variety of ways, such as color-slice, iso-surface or vector representation. A curve plotting module allows for displaying parametric plots of arbitrary quantities using various line styles, symbols and colors.
In steppings, splits, DOE and optimizer setups, Vision can show results as they come in, while simulations are running. This supports highly efficient use, and helps refining experiment setups early – allowing engineers to get valuable results quickly as well as generate meaningful reports in less time.
GTS Vision helps creating clear data plots intuitively. Thus, it supports engineers in quickly interpreting simulation results and generating meaningful reports in less time.
Features
Device Visualization
- Geometry, mesh, and segments
- Scalar and vector quantities
- Point defects (traps, dopants)
- Cross-sections (cut planes) and cut lines
- Various color scales and display modes (surface, iso face, vector,…) with appealing rendering
- Unstructured and structured meshes
- Export images and videos
Graph Plotting
- Linear / Logarithmic plotting with optional auto-scaling
- Parametric plotting and comparing multiple curves
- Histograms
- Post-processing (ION, IOFF, VTh, custom functions)
- Import / export of measurement and simulation data
Environment
- Integrated in GTS Framework
- Intuitive graphical user interface
- Comprehensive scripting interface

, Vth_sat")
 simulation")

Always at Hand, Easy and Efficient
The value drawn from any data depends on how well and how fast one can visualize, compare, evaluate it to grasp the essence. GTS Vision is always there to do so, with little effort – at each step of your tool flow, and for complex jobs even while simulations are running. That way, supporting early tuning of experiment setups, Vision is helping engineers to get valuable results faster as well as generate meaningful reports in less time.